Hubspot and Mention analysed 110 million posts across 1 million users – 85 million posts from North America and 1.6 million from the United Kingdom and Ireland.
Here’s what they found out about average engagement and best practices for Instagram…
The growth of Instagram accounts
With 1.3 billion active users, Instagram is one of the most popular social networks in the world. User’s accounts are growing.
Over half the top 50 accounts have between 60M and 100M followers. That is a huge jump from the previous year, when accounts in the top 50 has at least 14M followers.

But is followers the only important metric? As expected, it is not.
It’s not necessarily the size of an influencer’s community that matters, but how strongly they connect with them. That’s why micro-influencers (10k to 50k followers), and nano-influencers (under 10k), are considered by many to be the next wave of influencer marketing.
They reiterate that brands looking to work with influencers this year shouldn’t focus on follower numbers, instead they should look at working with influencers who share similar values, who they connect with and who have their ideal audience.
Benchmark your engagement rate
In the report, Hubspot and Mention define engagement as the total number of likes and comments on a single post.
To calculate the engagement rate, they divided that number by how many followers a user has.
So how does engagement look?
Globally, the average engagement rate last year was 5.86% or around 460 engagements per post.
For an account with 1,000 followers, the average would mean about 50 people engaging with each new post.
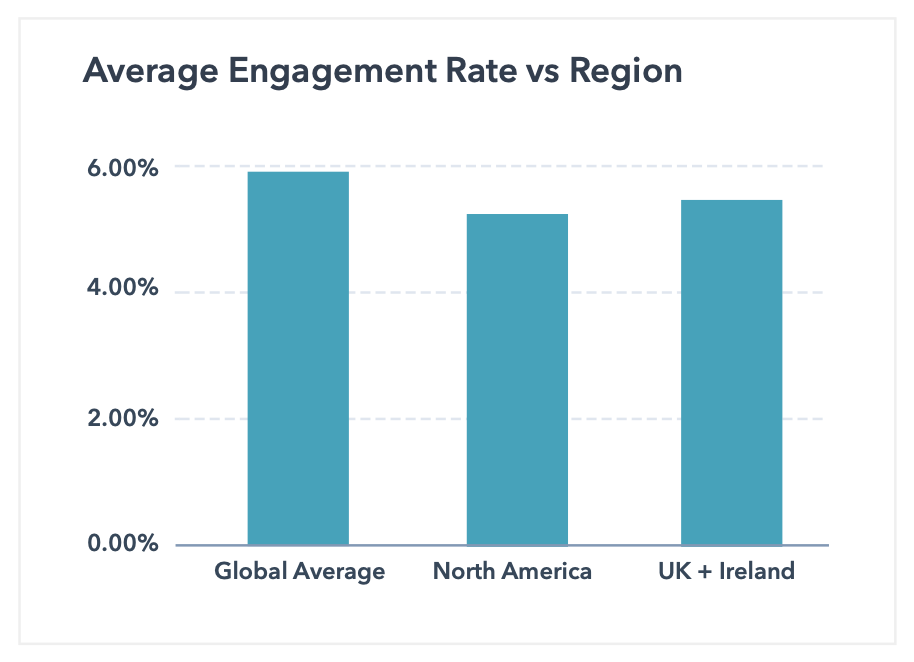
In both North America and the UK, the average engagement rate was slightly lower.
In North America, the average engagement rate was 5.21% (or approximately 403 engagements) per post. While in the UK and Ireland, the average engagement rate was 5.43% (or approximately 370) engagements per post.
To improve engagement with your audience, they recommend knowing your voice, fine-tuning your bio, posting consistently, collaborating often and promoting your content outside of Instagram.
What format do users prefer?
Globally, video is the most engaging type of content, bringing in an average of 24 comments and 1097 likes per post.
Carousel posts come in second, with 23 average comments and 933 likes.
When calculated by median however, the opposite was true. Carousel posts have a median of 70 comments compared to video posts with 46 comments.
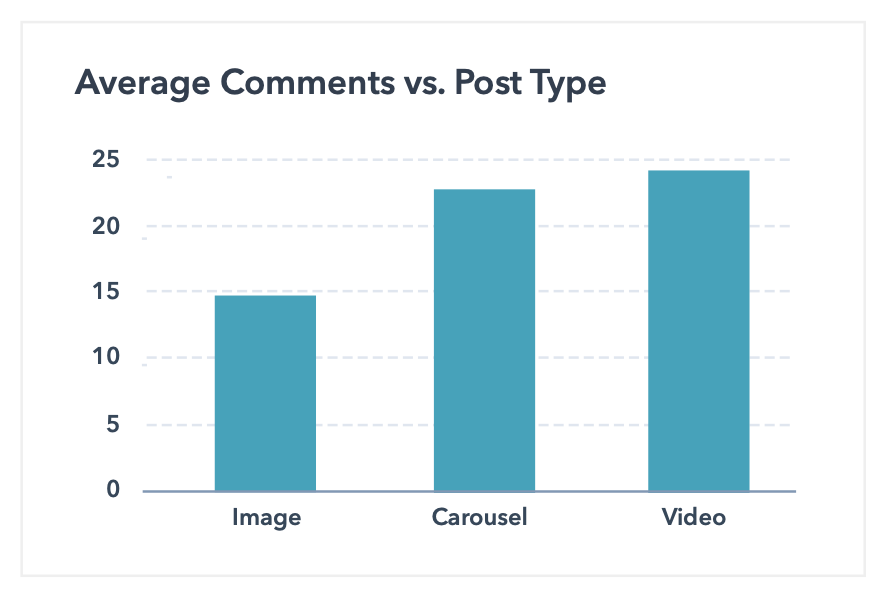
While in North America, the UK and Ireland, carousels bring in the most likes and comments.
What about captions?
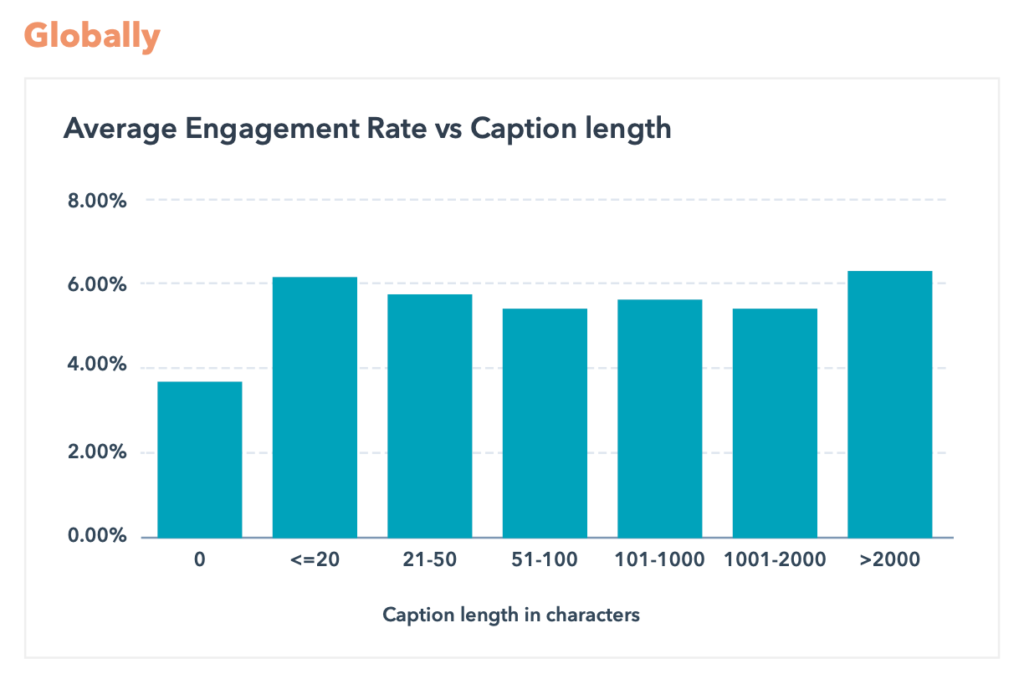
Including a caption gives you a significant boost in engagement, from just under 4% to over 6%.
They found keeping it brief at under 20 characters or going long at 2000 characters performed best. And including at least 1 emoji resulted in higher engagement globally.
To write the perfect caption, they recommend staying true to your voice, starting strong with a great hook, telling a story, offering value and including a call to action letting your audience know what next step you’d like them to take.
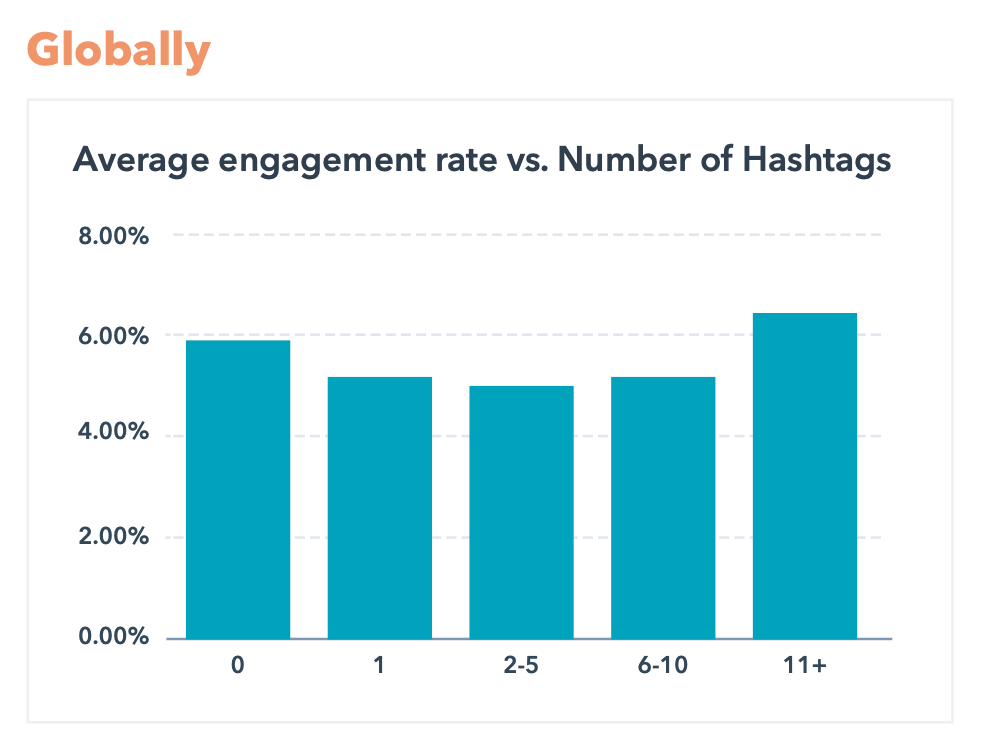
How should hashtags be used?
Despite what Adam Mosseri said about hashtags not improving reach, this report found that globally, the more hashtags used the better the results.
The most engaging hashtags were highly niche, targeting specific interests and communities so keep hashtags relevant to your audience.
Posts with zero hashtags performed well. However, it’s highly likely that a small number of mega-accounts are skewing this metric.
In the UK and Ireland, small business-related hashtags dominated, along with arts and crafts related content.
It helps to choose hashtags from the 5 main categories: location, branded, industry, community and descriptive, in order to reach many different groups of people.
The trick is to do some hashtag research, figure out how many people are using it, how active it is and the type of content that achieves the best results.
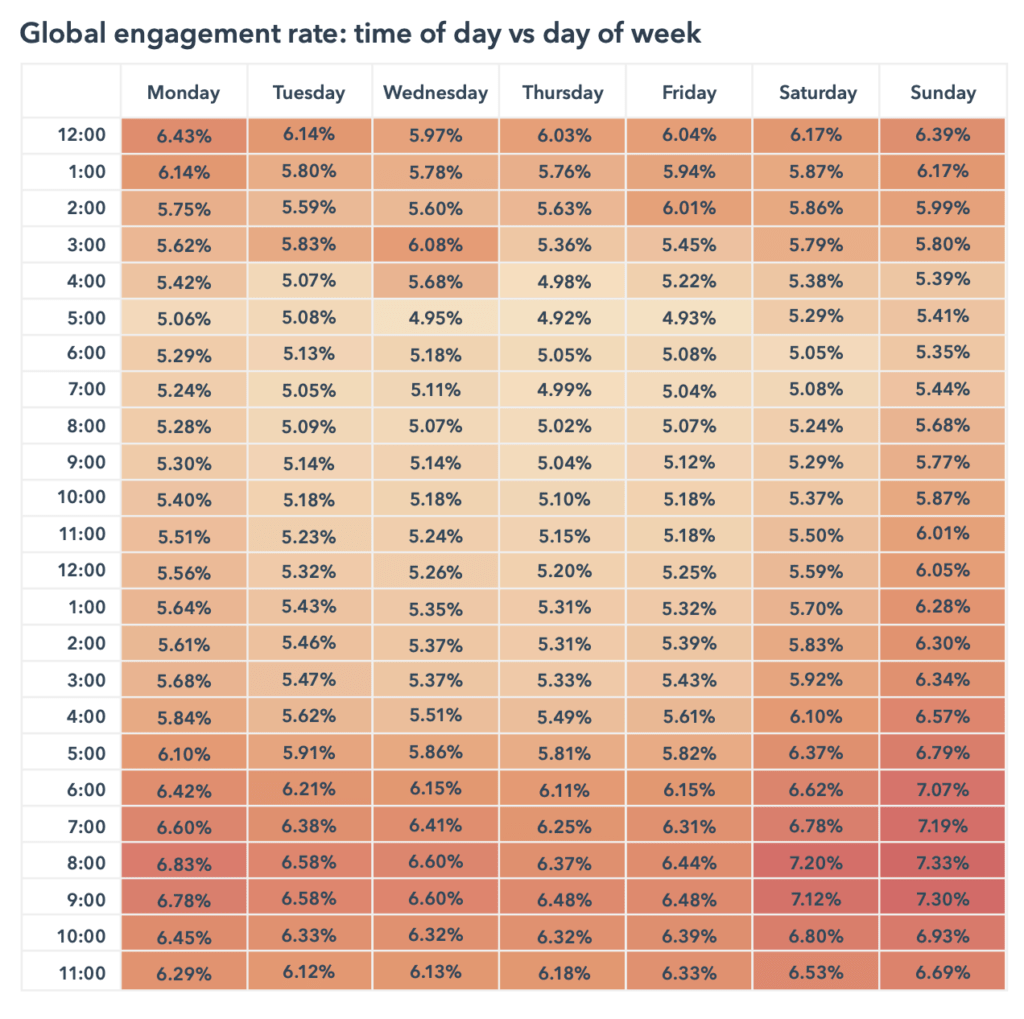
What time is the best to post?
Timing is an important factor to consider when it comes to your Instagram strategy. The best time to post is different for every Instagram account, however the data does show some clear trends.
Keep in mind that the data in this report is based on your audience being in the same time-zone as the account you’re posting from.
The overall data shows that content posted between 6-9pm got the highest engagement rate and in general, engagement remains high from evenings until midnight.
What about days of the week? Weekends are slightly higher in terms of engagement. Sunday comes in on top with an average engagement rate of 6.47%. Saturday and Monday have 6.05% and 5.95%, respectively. Then from Tuesday to Friday, the average engagement rate hovers around 5.6%.
Looking at engagement volume rather than engagement rate, the data shows that Wednesday emerges as the mid-week winner with 461 average engagements.
In North America, posting between 5pm and 12am offers the best engagement rate, but lower engagement volume.
For the UK, posting between 5pm and 12am is a good time for engagement. However, content shared at 1pm and 2am brought in the highest volume of engagements on average.
How to figure out the best time for you to post
Use analytics to figure out when your followers are most active. Think about where they are located and if they are in a different time zone than you. Keep track of your content and look for patterns in your best performing posts.
Engaging a global audience
While Instagram is not the top social network everywhere, it is growing globally. The majority of Instagram users are in America (49.4%) and Europe (28.7%), and the most Instagram posts come from the United States, Brazil and the United Kingdom.
If you’ve got a global audience, you can also use insights to figure out where your users are located, the language and demographics in order to customise your content.

Conclusion
Instagram has changed a lot over the years, so has the way people use it. With more users on the platform, there’s more competition and it’s easy to feel like your content is getting lost in the noise. Using this data from 2022, we can reconfigure our strategies to ensure we’re reaching the right audiences and improve our engagement.